Caterelo
Relocation intelligence for Southern Europe
- 90
- Regions Tracked
- 6
- Countries
- 13
- Data Signals
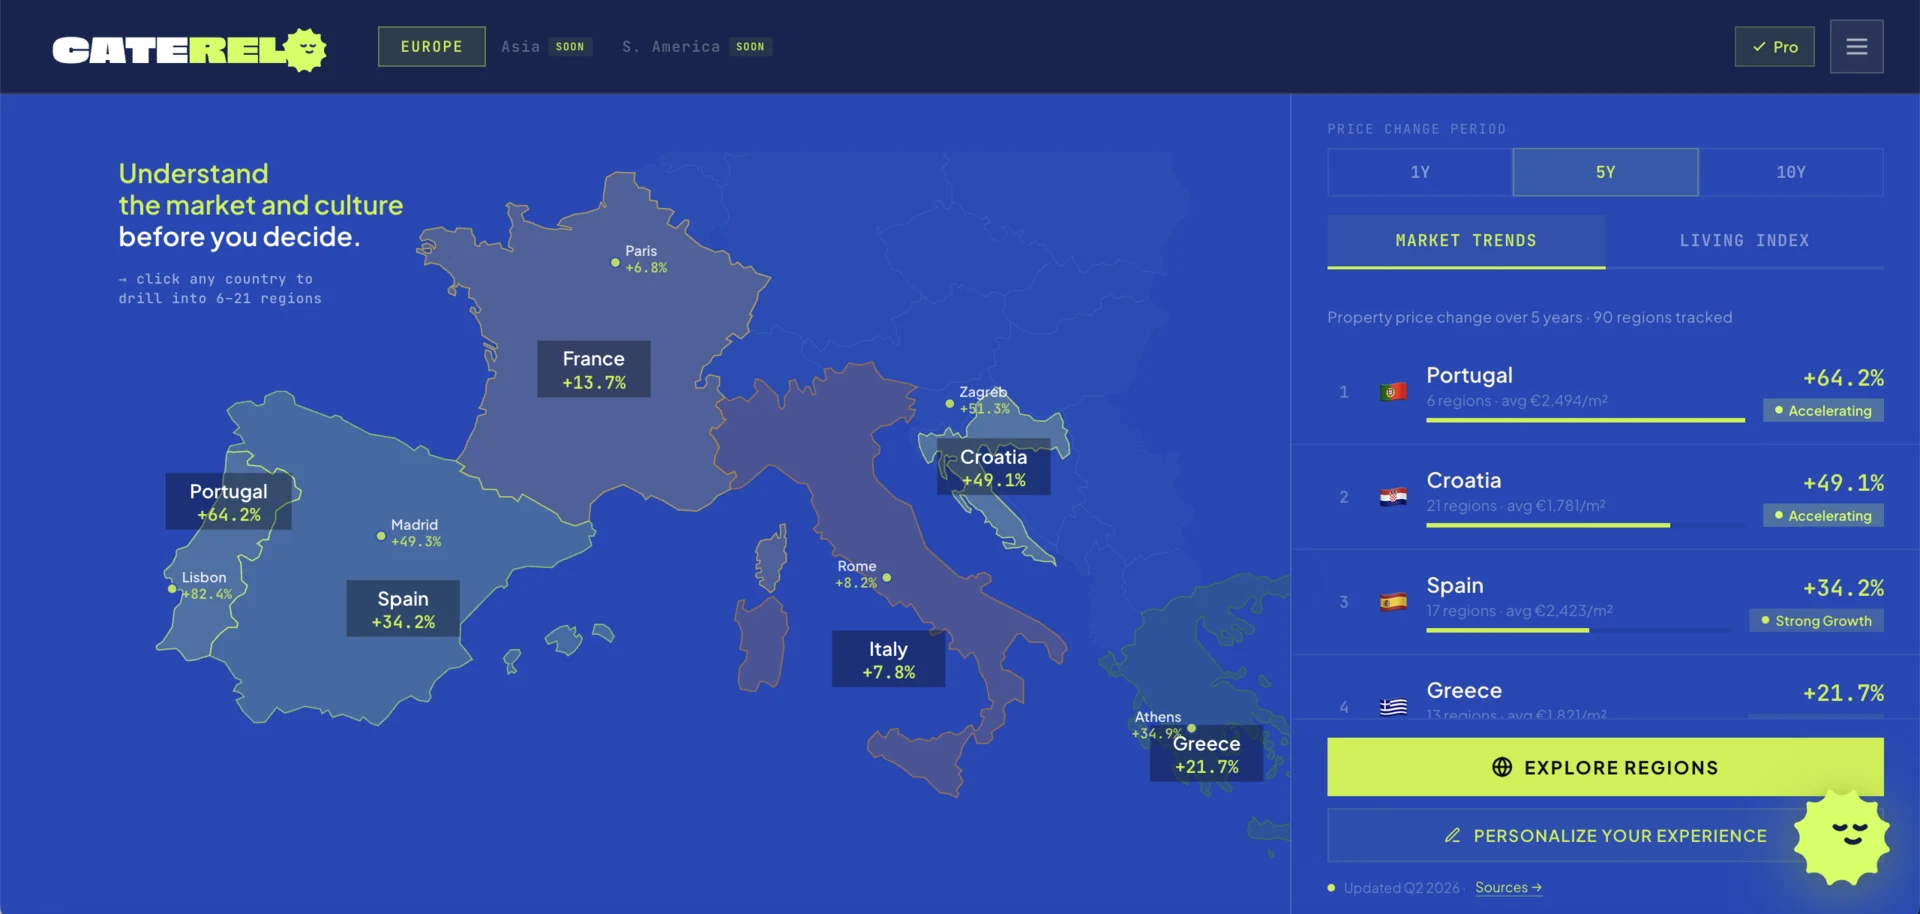
Caterelo is our own product: a platform that helps people decide where in Southern Europe to move, built for remote workers, families, expats and second-home buyers. It covers 90 regions in Spain, Italy, Portugal, Greece, France and Croatia, reads each one through 13 signals across 7 decision dimensions and draws on more than 60 official and public sources. We designed it, built it and run it ourselves.
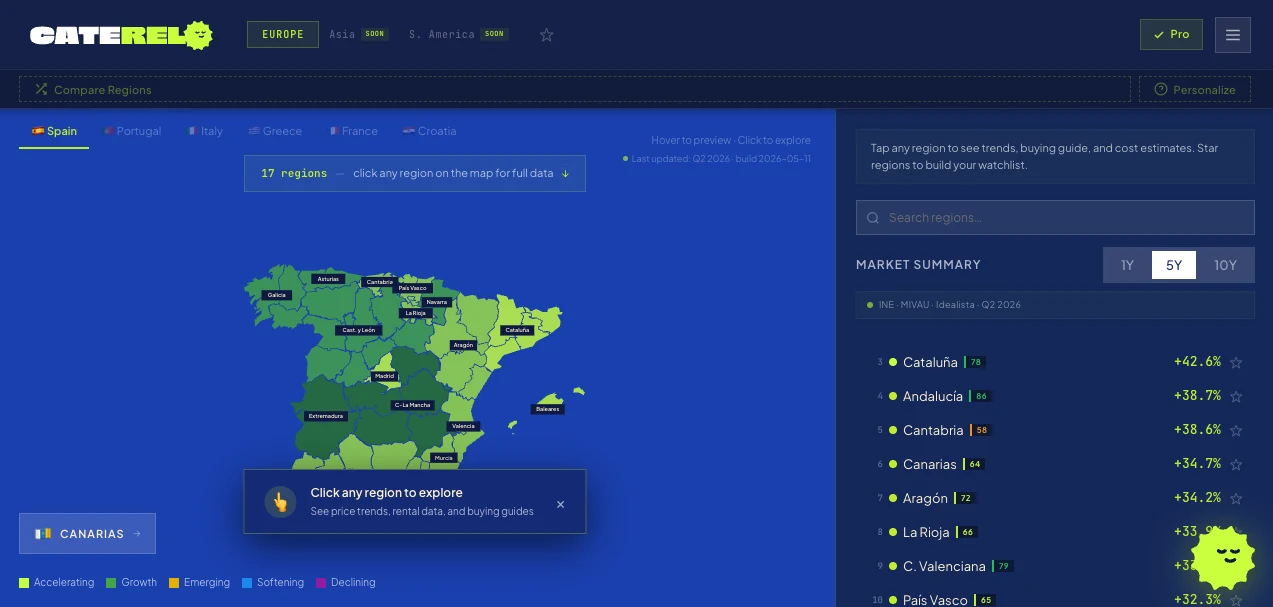
From Europe to a single region
The problem
Choosing a region to move to means reading property prices, climate, healthcare, safety and daily costs from dozens of sources in several languages, most of them made for statisticians rather than for a family deciding where to live. At the same time we sell a way of building systems, and that is only credible when we use it on our own work, in production, with no client to share the risk.
What we took responsibility for
Everything, because the product is ours: the positioning, the data layer and its sources, the product design, the code and the decision on what ships and when.
Capabilities at work
- Strategy & Design
- One question for one buyer: which region fits my life, not which country is in fashion. Seven decision dimensions, from safety and climate to healthcare and schools, shape every screen.
- Digital products
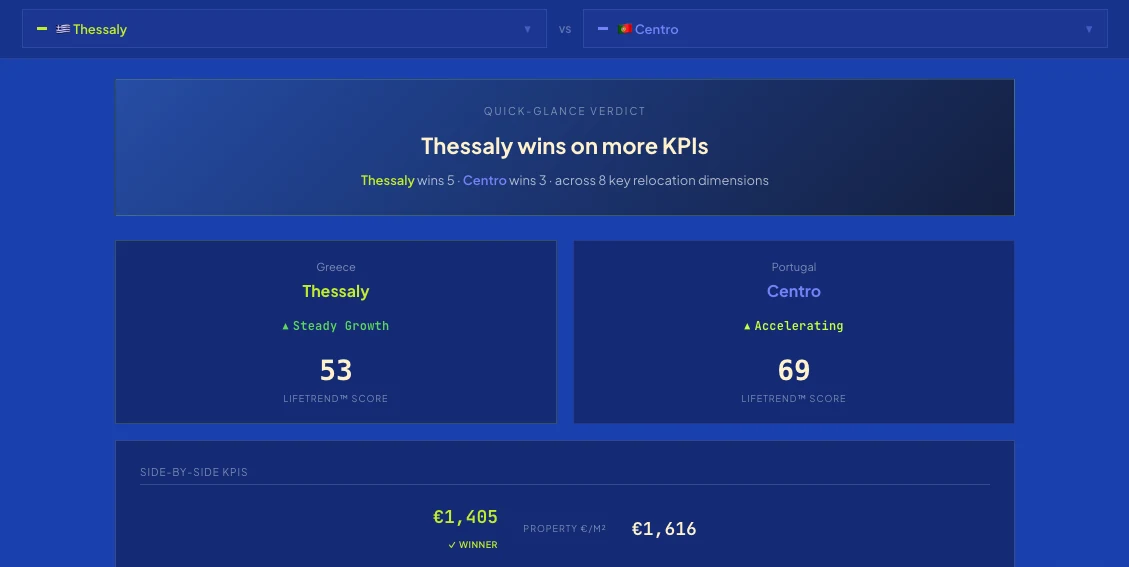
- A map from Europe down to a region, a comparison of any two of 90 regions, a price chart, a renovation calculator and a REST API for developers.
- AI elevation
- A 15-question quiz turns personal priorities into a ranking, an AI advisor answers questions from the same data, and live feeds for weather, air quality and currency keep it current.
Decisions
We started from the decision, not from the data. The 15-question quiz asks what matters to the person, and the ranking follows that answer. Every region is read through the same 13 signals and 7 dimensions, so any two of the 90 can be compared on equal terms. Every figure keeps its source, and the product says when it was last updated. Southern Europe first, with other continents marked as coming later rather than half-built.
How we delivered
One data layer under every screen: the map, the comparison, the region sheet, the chart and the calculator read the same records, and the REST API opens that layer to developers. The sources are official and public: Eurostat, OECD, IPCC AR6 for the Climate 2050 projections, and national statistics offices such as INE, ISTAT, INSEE, ELSTAT and DZS. One operator makes the product decisions, AI does the assembly between them.
The work
Two regions, side by side
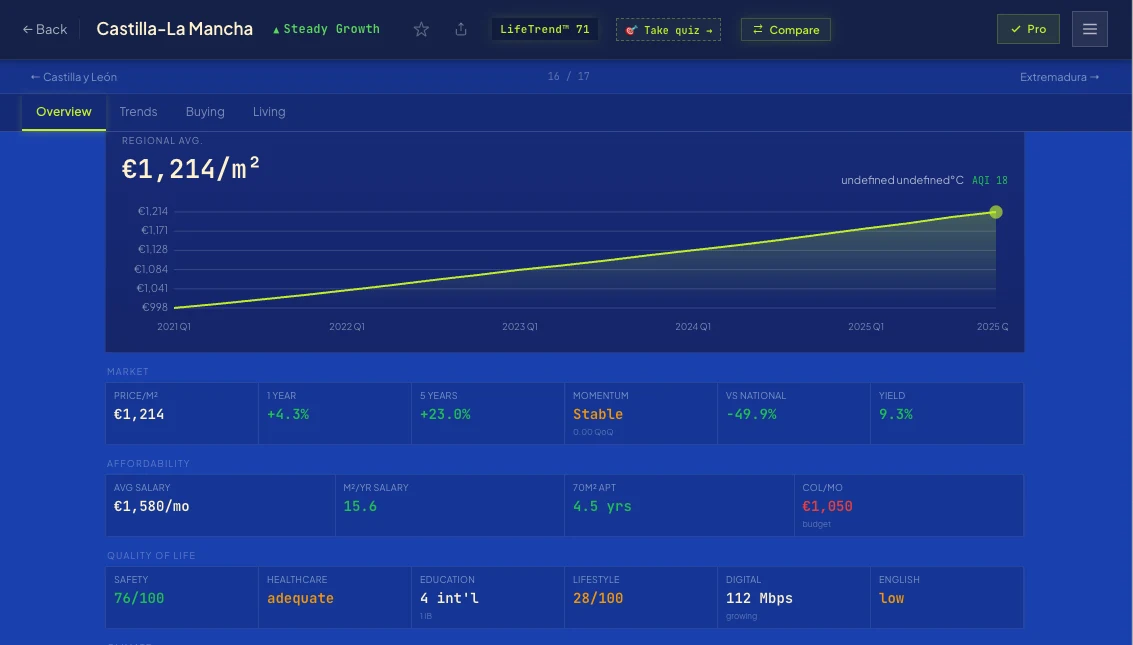
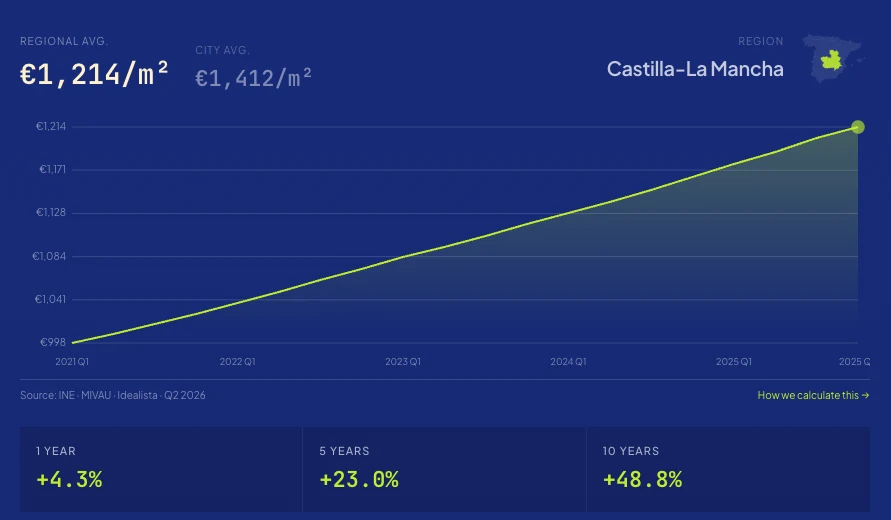
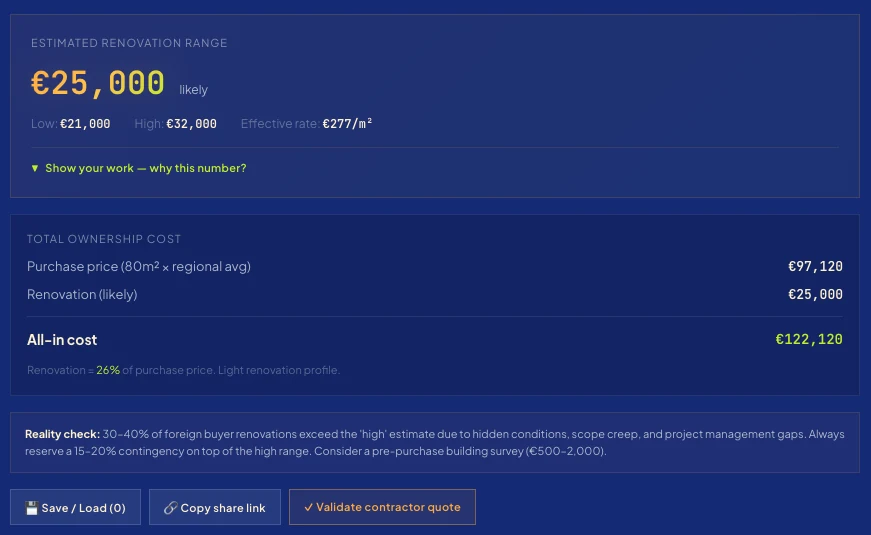
Price history and the full cost of a home
The brand: one sun over Southern Europe
"We sell a method. The strongest proof is to use it on our own product and ship it.
Outcome
Live at caterelo.com, with a free tier and a paid Founding Access for 90 days. 90 regions in 6 countries are scored and comparable, more than 60 official sources are connected, Climate 2050 projections and live feeds run in production, and a REST API is open to developers.
Reflection
Building your own product changes how you consult. You stop selling promises and start showing work you have already done on yourself, and that carries into every client conversation that follows.